This investigation examined the bacterial profile and patterns of antibiotic resistance among cancer patients receiving care at B.P. Koirala Memorial Cancer Hospital in Bharatpur, Chitwan. Employing a hospital-based cross-sectional design, the study processed 384 clinical specimens obtained from cancer patients. Once bacterial growth was observed on selective and differential culture media, Gram staining was used as a preliminary identification method. Organisms were subsequently characterized based on their biochemical features, and antibiotic susceptibility testing was performed using the Kirby-Bauer disk diffusion technique. The results, measured by determining the diameter of the inhibition zones, adhered to the Clinical and Laboratory Standards Institute (CLSI) guidelines established in 2020. Data analysis was conducted using SPSS version 20.0.
Among the 384 individuals included, 55.4% were male and 44.6% female. Bacterial growth was detected in 43.5% of the total specimens analyzed. A comparison between cancer types showed that hematogenous malignancies accounted for 40.7% of the positive cultures, while 45.5% were associated with non-hematogenous cancers. The most frequently isolated organism was Escherichia coli, making up 38.9% of isolates, followed by Klebsiella species (20.4%), Pseudomonas species (19.2%), Citrobacter species (9.0%), and Acinetobacter species (4.8%). Additionally, Staphylococcus aureus and Enterobacter aerogenes were detected in 3.6% and 3.0% of cases, respectively, while Proteus species and coagulase-negative Staphylococci (CoNS) accounted for 0.6% each. Regarding antibiotic resistance, E. coli demonstrated substantial resistance to amoxicillin (98.5%), followed by ciprofloxacin (73.9%) and cotrimoxazole (67.7%), whereas resistance to amikacin remained low. In contrast, S. aureus, the predominant gram-positive isolate, exhibited complete resistance (100%) to amoxycillin, ciprofloxacin, cloxacillin, and cephalexin (each at 66.7%), but remained fully sensitive to both Amikacin and Tigecycline. Overall, gram-negative bacteria were more frequently identified than gram-positive bacteria. The findings highlight the vulnerability of cancer patients to infections by opportunistic organisms, including multidrug-resistant (MDR) strains, underscoring the urgent need for robust antimicrobial stewardship and ongoing surveillance of antibiotic resistance trends.
Cancer arises from the abnormal and uncontrolled multiplication of cells, which can progressively invade surrounding tissues and eventually metastasize to distant sites in the body. Globally, cancer accounted for approximately 9.6 million deaths in 2018, ranking as the second leading cause of mortality. Among males, lung, colorectal, liver, and prostate cancers are the most prevalent forms, whereas breast, lung, colorectal, cervical, and thyroid cancers are more frequently observed in females [1]. Notably, the incidence has increased sharply among men aged 45–49 years and women aged 30–34 years, with the highest rates observed in males aged 70–74 years and females aged 65–69 years. As projected in 2020, the cancer incidence rate per 100,000 population was estimated at 41.4 in women and 38.5 in men [2].
Due to both the pathophysiological mechanisms of cancer and the immunosuppressive nature of treatments like chemotherapy, cancer patients are typically immunocompromised [3]. Despite advancements in oncologic therapies, these patients continue to face significant risks from infectious complications, often resulting in considerable morbidity and mortality. Surgical interventions, particularly in individuals with solid tumors or other medical indications, elevate the likelihood of acquiring bacterial infections. These infections can originate from the patient’s endogenous flora or be introduced through external sources within healthcare settings—such as airborne contaminants, contact with healthcare workers, hospital surfaces, or contaminated medical devices [4]. Consequently, individuals with solid tumors or hematological malignancies are highly vulnerable to a broad range of bacterial pathogens. Among these, gram-positive cocci such as Staphylococcus spp. and gram-negative bacilli, including Escherichia coli, Klebsiella pneumoniae, and Pseudomonas aeruginosa, are frequently implicated in infections affecting cancer patients [5, 6].
The distribution of bacterial pathogens and their corresponding antibiograms varies significantly not only between countries but also among different healthcare institutions and even within the same hospital, such as intensive care wards [7]. Therefore, having localized data on microbial profiles and associated antibiotic resistance patterns is essential for guiding clinicians in selecting effective empirical therapy [8].
Repeated hospital admissions, the necessity of invasive procedures, chemotherapy, and the frequent use of broad-spectrum antimicrobial agents have been identified as major contributors to infection risk in cancer patients [9, 10].
In view of these concerns, the present study was undertaken to investigate the bacterial profile and antibiotic resistance patterns among cancer patients treated at B.P. Koirala Memorial Cancer Hospital in Bharatpur, Chitwan.
This investigation adopted a quantitative, hospital-based cross-sectional design, conducted over six months from December 2020 to May 2021. A total of 384 cancer patients, either receiving outpatient care or admitted for treatment at B.P. Koirala Memorial Cancer Hospital in Bharatpur, Chitwan, Nepal, were enrolled in the study. Sample collection and microbiological analysis were executed at the hospital’s Department of Microbiology. Individuals currently undergoing antibiotic treatment for conditions other than cancer were excluded from participation. Ethical clearance was obtained from the Pokhara University Research Committee (Ref. no.: 56/077/078). Written and verbal informed consent was obtained from each participant, and the study objectives were clearly communicated. Sociodemographic data, including age, gender, level of education, occupation, marital status, ethnicity, and religious background, were collected using a structured questionnaire.
All biological samples were obtained in strict accordance with the guidelines established by the American Society of Microbiology (ASM) [11]. Clinical specimens—including blood, urine, pus, sputum, ulcer scrapings, and skin samples—were collected aseptically and promptly transported to the microbiology laboratory for further processing. Each sample was subjected to routine microbiological techniques. Bacterial isolates were differentiated using a combination of phenotypic methods, including Gram staining, catalase and coagulase testing, oxidase reaction, sugar fermentation using triple sugar iron (TSI) agar, motility testing, indole production, hydrogen sulfide formation in SIM media, citrate utilization, and urease activity.
To assess antibiotic resistance, isolates were subjected to antimicrobial susceptibility testing using the Kirby-Bauer disk diffusion method on Mueller-Hinton agar (MHA) (Hi-media, India), in accordance with the Clinical and Laboratory Standards Institute (CLSI) guidelines. Each bacterial suspension was adjusted to match a 0.5 McFarland turbidity standard, equivalent to approximately 1.5×10⁸ CFU/ml. Five distinct antibiotic-impregnated disks were carefully placed on the inoculated MHA plates, maintaining a minimum distance of 24 mm between the centers of adjacent disks. Plates were incubated aerobically at 37 °C for 18–24 hours [12, 13].
After incubation, the diameter of the zone of inhibition (including the disk) was measured in millimeters for each antimicrobial agent. Results were interpreted using the CLSI-recommended breakpoint chart to classify isolates as ‘sensitive’, ‘intermediate’, or ‘resistant’ [12]. For internal quality assurance, Staphylococcus aureus ATCC 25923 was used as a control strain during each testing session [12]. Isolates exhibiting resistance to at least three classes of first-line antibiotics were categorized as multidrug-resistant (MDR) [14].
The statistical evaluation included descriptive analyses, including frequency distributions and percentage calculations. Both parametric and nonparametric tests were applied depending on the data’s scale. All outcomes were reported with 95% confidence intervals, and statistical significance was determined at P < 0.05.
In the current study, a total of 384 clinical specimens were examined, with pus being the predominant sample type, accounting for 155 cases (40.4%). This was followed by urine samples, which accounted for 148 cases (38.5%), while blood and sputum contributed 56 (14.6%) and 25 (6.5%) samples, respectively. Of the 384 patients included in the study, 213 were male and 171 were female, with the highest representation in both sexes falling within the 41–60 age bracket.
Bacterial culture results indicated that 217 samples (57%) did not yield microbial growth, while 167 samples (43%) were culture-positive. Among the identified bacterial species, Escherichia coli was the most commonly isolated organism, comprising 38.9% (n = 65) of the total positive cultures. This was followed by Klebsiella species (20.4%, n=34), Pseudomonas species (19.2%), Citrobacter species (9.0%), and Acinetobacter species (4.8%). Additionally, S. aureus and Enterobacter aerogenes accounted for 3.6% and 3.0% of the isolates, respectively, while Proteus species and Coagulase-negative staphylococci (CoNS) were the least prevalent, each making up 0.6% of the positive cultures.
The microbiological distribution revealed a marked predominance of gram-negative bacteria, accounting for 95.8% (n = 160) of the isolates, compared to only 4.2% (n = 7) for gram-positive bacteria. The proportion of samples with no microbial growth varied by specimen type: 31.6% of pus, 70.9% of urine, 87.5% of blood, and 56.0% of sputum samples were culture-negative, as illustrated in Table 1.
An analysis based on cancer classification showed that culture-negative outcomes were found in 59.2% of patients with Hematogenous cancer and 54.5% among those with Non-hematogenous malignancies, as presented in Table 2. Furthermore, associations between bacterial isolates and sociodemographic characteristics—including age group, sex, ethnicity, religious affiliation, and marital status—are detailed in Table 3.
Of the 167 culture-positive isolates, 65.3% (n = 109) were identified as multi-drug resistant (MDR), whereas 34.7% (n = 58) were categorized as non-MDR. The breakdown of MDR versus non-MDR organisms is provided in Table 4, highlighting the significant burden of Antibiotic resistance among isolates from cancer patients in this setting.
Table 1. Sample-wise distribution of isolates
Isolation | Sample type | |||||||
Pus | Urine | Blood | Sputum | |||||
N | % | N | % | N | % | N | % | |
Escherichia coli | 36 | 34.0 | 24 | 55.8 | 2 | 28.6 | 3 | 27.3 |
Klebsiella spp. | 18 | 17.0 | 8 | 18.6 | 3 | 43.0 | 5 | 45.4 |
Pseudomonas spp. | 26 | 24.5 | 3 | 7.0 | 0 | 0.0 | 3 | 27.3 |
Citrobacter spp. | 11 | 10.4 | 3 | 7.0 | 1 | 14.2 | 0 | 0.0 |
Acinetobacter spp. | 3 | 2.9 | 5 | 11.6 | 0 | 0.0 | 0 | 0.0 |
S. aureus | 5 | 4.7 | 0 | 0.0 | 1 | 14.2 | 0 | 0.0 |
E. aerogenes | 5 | 4.7 | 0 | 0.0 | 0 | 0.0 | 0 | 0.0 |
Proteus spp. | 1 | 0.9 | 0 | 0.0 | 0 | 0.0 | 0 | 0.0 |
CoNS | 1 | 0.9 | 0 | 0.0 | 0 | 0.0 | 0 | 0.0 |
Total | 106 |
| 43 |
| 7 |
| 11 |
|
Table 2. Distribution of organisms in different cancers
Organisms isolated | Type of cancer | p-value | |||
Hematogenous Cancer | Non-hematogenous Cancer | ||||
N | % | N | % | ||
Escherichia coli | 33 | 50.0 | 32 | 31.7 |
|
Klebsiella spp. | 12 | 18.2 | 22 | 21.8 |
|
Pseudomonas spp. | 12 | 18.2 | 20 | 19.8 |
|
Citrobacter spp. | 4 | 6.1 | 11 | 10.9 |
|
Acinetobacter spp. | 1 | 1.5 | 7 | 6.9 | 0.218 |
S. aureus | 1 | 1.5 | 5 | 5.0 | |
E. aerogenes | 2 | 3.0 | 3 | 2.9 |
|
Proteus spp. | 0 | 0 | 1 | 1.0 |
|
CoNS | 1 | 1.5 | 0 | 0 |
|
Total | 66 |
| 101 |
|
|
Table 3. Relationship between organisms and sociodemographic variables (age, gender, ethnicity, religion, and marital status)
Independent variable | Organism isolated | |||||||||
E. coli | Klebsiella spp. | Pseudomon as spp. | Citrobacter spp. | Proteus spp. | Acineto bacter Spp. | CoNS | Enterobacter spp. | S. aureus | ||
Age (years) | ≤ 20 | 7 (35.0%) | 8 (40.0%) | 4 (20.0%) | 1 (5.0%) | 0 | 0 | 0 | 0 | 0 |
21-40 | 17 (47.2%) | 16 (16.7%) | 5 (13.9%) | 2 (5.5%) | 1 (2.8%) | 1 (2.8%) | 1 (2.8%) | 0 | 3 (8.3%) | |
41-60 | 30 (40.5%) | 11 (14.9%) | 12 (16.2%) | 9 (12.1%) | 0 | 6 (8.1%) | 0 | 4 (5.4%) | 2 (2.7%) | |
≥ 61 | 11 (29.7%) | 9 (24.3%) | 11 (29.7%) | 3 (8.1%) | 0 | 1 (2.7%) | 0 | 1 (2.7%) | 1 (2.7%) | |
Gender | Male | 43 (42.1%) | 15 (14.7%) | 22 (21.6%) | 15 (14.7%) | 0 | 3 (2.9%) | 0 | 1 (0.9%) | 3 (2.9%) |
Female | 22 (33.8%) | 19 (29.2%) | 10 (15.3%) | 0 | 1 (1.5%) | 5 (7.7%) | 1 (1.5%) | 4 (6.1%) | 3 (4.6%) | |
| Brahmin | 29 (41.4%) | 14 (20.0%) | 16 (22.8%) | 2 (2.8%) | 0 | 5 (7.1%) | 1 (1.4%) | 2 (2.8%) | 1 (1.4%) |
| Chhetri | 13 (43.3%) | 5 (16.7%) | 6 (20.0%) | 3 (10.0%) | 0 | 2 (6.7%) | 0 | 0 | 1 (3.3%) |
Ethnicity | Janajati | 11 (28.2%) | 12 (30.8%) | 5 (12.8%) | 6 (15.3%) | 1 (2.6%) | 1 (2.6%) | 0 | 2 (5.1%) | 1 (2.6%) |
| Dalit | 9 (40.9%) | 2 (9.0%) | 5 (22.7%) | 3 (13.6%) | 0 | 0 | 0 | 1 (4.5%) | 2 (9.0%) |
| Others | 3 (50.0%) | 1 (16.7%) | 0 | 1 (16.7%) | 0 | 0 | 0 | 0 | 1 (16.7%) |
| Hindu | 60 (39.2%) | 30 (19.6%) | 32 (20.9%) | 11 (7.1%) | 1 (0.6%) | 8 (5.2%) | 1 (0.6%) | 5 (3.3%) | 5 (3.3%) |
Religion | Muslim | 3 (50.0%) | 1 (16.7%) | 0 | 1 (16.7%) | 0 | 0 | 0 | 0 | 1 (16.7%) |
| Christian | 2 (25.0%) | 3 (37.5%) | 0 | 3 (37.5%) | 0 | 0 | 0 | 0 | 0 |
Marital status | N/A | 3 (33.3%) | 3 (33.3%) | 2 (22.2%) | 1 (11.1%) | 0 | 0 | 0 | 0 | 0 |
Married | 58 (40.2%) | 24 (16.7%) | 27 (18.7%) | 14 (9.7%) | 1 (0.7%) | 8 (5.5%) | 1 (0.7%) | 5 (3.4%) | 6 (4.1%) | |
Un-married | 4 (28.5%) | 7 (50.0%) | 3 (21.4%) | 0 | 0 | 0 | 0 | 0 | 0 | |
Table 4. Distribution of MDR and Non-MDR organisms
Organisms isolated | Multi-drug resistant | |||
Non-MDR | MDR | |||
N | % | N | % | |
Escherichia coli | 13 | 20.0 | 52 | 80.0 |
Klebsiella spp. | 13 | 38.2 | 21 | 61.8 |
Pseudomonas spp. | 12 | 37.5 | 20 | 62.5 |
Citrobacter spp. | 11 | 73.3 | 4 | 26.7 |
Proteus spp. | 0 | 0 | 1 | 100 |
Acinetobacter spp. | 4 | 50.0 | 4 | 50.0 |
CoNS | 1 | 100 | 0 | 0 |
E. aerogenes | 3 | 60.0 | 2 | 40.0 |
S. aureus | 1 | 16.7 | 5 | 83.3 |
The resistance profile of E. coli isolates revealed exceptionally high amoxicillin resistance in 98.5% of cases, making it the least effective antibiotic against these strains. This was followed by ciprofloxacin, to which 73.9% of the isolates were resistant. Resistance was also notable for other antimicrobials, including cotrimoxazole (67.7%), levofloxacin (50.8%), and gentamicin (44.7%). Furthermore, 32.4% of the isolates exhibited resistance to piperacillin-tazobactam, while lower resistance rates were seen with tigecycline (18.5%) and amikacin (17.0%), as illustrated in Figure 1.
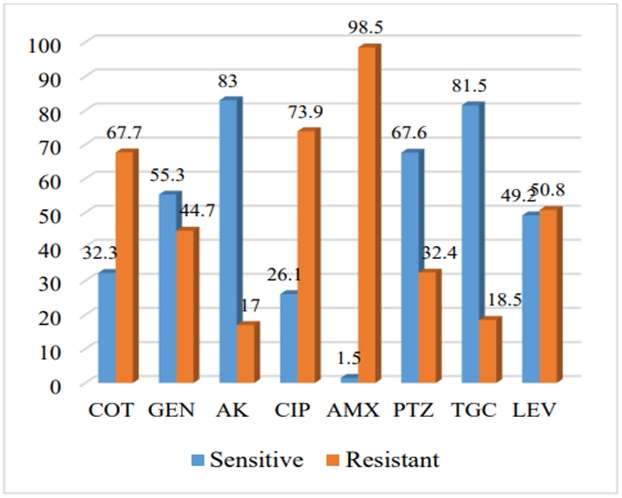
Figure 1. Antibiotic pattern of E.coli.
The resistance trends observed in Klebsiella spp. isolates demonstrated a complete resistance (100.0%) to amoxicillin, while 70.6% were resistant to cotrimoxazole. Other resistance rates included 55.9% to gentamicin, 47.1% to ciprofloxacin, and 35.3% to amikacin. Additionally, resistance to piperacillin-tazobactam, levofloxacin, and tigecycline was recorded at 32.4%, 29.5%, and 14.8%, respectively.
In Pseudomonas spp., all isolates (100.0%) were resistant to cotrimoxazole, and 93.8% were resistant to amoxicillin. Resistance to gentamicin and tigecycline was observed in 37.5% and 34.4% of isolates, respectively, followed by ciprofloxacin (25.0%), levofloxacin (18.8%), amikacin (15.7%), and the lowest resistance to piperacillin-tazobactam (12.5%).
For S. aureus, the isolates displayed full resistance (100.0%) to amoxicillin, while 66.7% were resistant to cephalexin, cloxacillin, and ciprofloxacin. Half of the isolates were resistant to both cotrimoxazole and gentamicin (50.0%). In contrast, resistance was markedly lower with levofloxacin (16.7%) and none was observed with amikacin or tigecycline (0.0%), as depicted in Figure 2.
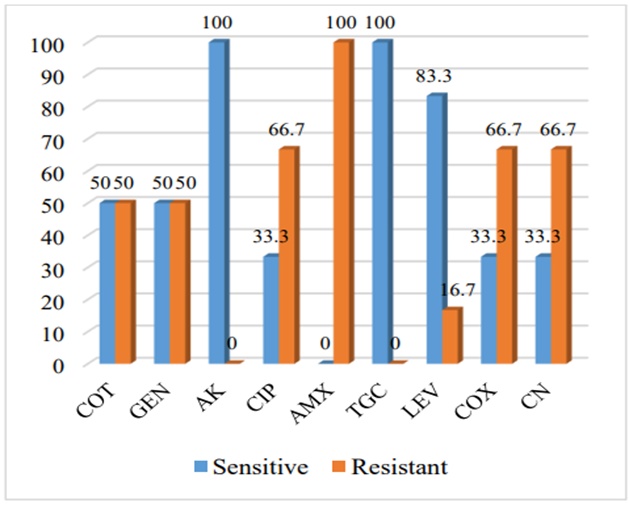
Figure 2. Antibiotic patterns of Staphylococcus aureus.
A hospital-based cross-sectional study using a quantitative approach was conducted at BPKMCH from December 2020 to May 2021 to evaluate the bacterial spectrum and antimicrobial susceptibility test (AST) profiles of isolates from cancer patients.
Of 384 clinical specimens analyzed, bacterial growth was detected in 167 (43.0%), while the remaining 217 (57.0%) showed no growth. The 43.0% infection rate aligns closely with previous studies such as Nurain et al. [15] in Sudan (48.1%) and Almaziny [16] in Iraq (average 44.2%). However, it is noticeably higher than reports by Fentie et al. [5] in Ethiopia (19.4%) and Eslami Nejad et al. [17] in Iran (24.6%), a difference that could stem from regional disparities, distinct patient demographics, and variations in therapeutic practices.
The bacterial isolates in this study were predominantly gram-negative, accounting for 95.8% of the total, while 4.2% were gram-positive. The predominance of gram-negative bacteria (GNB) among cancer patients aligns with findings from multiple investigations [7, 15, 18–21]. However, Fentie et al. [5] in Ethiopia found gram-positive cocci (GPC) to be more prevalent. The increasing dominance of GNB in cancer-associated infections may reflect changes in clinical protocols, such as reduced reliance on indwelling devices, less frequent administration of cytotoxic agents, and decreased routine use of prophylactic antibiotics [22, 23].
The distribution of specific organisms showed that E.coli was the leading isolate (38.9%), followed by Klebsiella spp. (20.4%), Pseudomonas spp. (19.2%), and Citrobacter spp. (9.0%), a pattern similarly documented by Sime et al. in Ethiopia [24]. Among gram-negative bacteria, E.coli comprised 40.6% of the isolates, with Klebsiella spp. at 21.3%. This finding contrasts with the study by Garg et al. [8] in India, where Klebsiella spp. was more frequent (34.78%) and E. coli was less common (18.84%). While Nurain et al. [15] reported Proteus spp. as the predominant pathogen at 23.5%, this study found it to be the least prevalent at just 0.6%, likely reflecting differences in antibiotic prescribing patterns.
Among gram-positive bacteria, S. aureus accounted for the majority of isolates (85.7%), followed by CoNS (14.3%). This is marginally higher than findings from Naznzeen et al. [7], who reported S. aureus at 65.38% among gram-positive organisms. However, this trend diverges from the prevalence reported by Kumar et al. [25].
With respect to sample-specific isolation, E. coli was the most frequent isolate in pus samples at 34.0%, a rate significantly higher than those recorded in several studies, which reported figures such as 13% [26], 8.3% [27], 16.5% [28], and 14.0% [29]. In urine cultures, E. coli was also the predominant organism at 55.8%, consistent with Shrestha et al., who found a similar prevalence of 58.0% [30]. However, Fentie et al. documented a lower occurrence of E. coli in urine (28.1%) [5]. In blood samples, Klebsiella spp. had the highest growth rate of 43.0%, closely matching the 50.0% reported by Kapoor et al. [20] in North India for bloodstream infections.
The study also revealed that cancer patients with non-hematological malignancies had a higher likelihood of bacterial growth than those with hematologic cancers. This pattern mirrors findings from Sirkhazi et al. [31], who reported higher infection rates in patients with solid tumors (53.77%) than in those with hematological malignancies (46.23%). In contrast, Al Mulla et al. [32] observed a greater frequency of infections in leukemic patients (47.8%) than in those with solid tumors (31.3%) [32], possibly due to differences in the frequency of surgical interventions and catheter use.
Multidrug-resistant (MDR) strains accounted for 65.3% of the isolates, a rate significantly below the 91.5% reported by Fazeli et al. [33], yet higher than those noted in the studies by Fentie et al. [5] (46.5%), Jiang et al. [34] (27.6%), and Cornejo-Juarez et al. [35] (39.5%). The prevalence of MDR pathogens varies across regions and continents [36].
Resistance mechanisms among gram-negative bacteria may involve Extended Spectrum Beta-Lactamase (ESBL) production, carbapenemase activity, or Metallo-beta-lactamase expression. In contrast, in gram-positive cocci, resistance is often mediated by methicillin resistance or inducible macrolide-lincosamide-streptogramin B (iMLSB) phenotypes in Staphylococcus and Enterococcus species.
The incidence of bacterial infections appears elevated among cancer patients undergoing chemotherapy. Within both hematogenous and non-hematogenous malignancy groups, E. coli demonstrated the highest isolation frequency, accounting for 50.7% and 31.7%, respectively. Among the gram-negative pathogens, E. coli exhibited pronounced resistance to amoxycillin (98.5%), with substantial resistance also observed against ciprofloxacin (73.9%) and cotrimoxazole (67.7%), whereas resistance to amikacin remained minimal. Regarding gram-positive bacteria, S. aureus showed complete resistance to amoxycillin (100%) and notable resistance to ciprofloxacin, cloxacillin, and cephalexin (66.7% each), yet retained full susceptibility to amikacin and tigecycline.
It is imperative to implement routine screening for MDR pathogens and to investigate probable AMR mechanisms—such as methicillin resistance, extended-spectrum β-lactamase production, inducible clindamycin resistance, and metallo-β-lactamase activity—in all clinical specimens evaluated for infectious agents. Ongoing surveillance of multi-drug resistance and associated AMR traits is critical for limiting the spread and severity of such infections.
We express our gratitude to the entire BPKMCH team for their assistance and collaboration.
None
None
The research was ethically approved by the PURC, Pokhara University (Ref. no.: 56/077/078), and informed consent was obtained from all participants involved.
Open Access The author(s) retain copyright. This article is licensed under the Creative Commons Attribution-NonCommercial-ShareAlike 4.0 International License. It may be shared and adapted for non-commercial purposes with appropriate attribution, an indication of changes, and distribution of adaptations under the same license. Third-party material may be subject to separate terms identified in its credit line. View the license at https://creativecommons.org/licenses/by-nc-sa/4.0/.
 Eurasian Academy of Medicine and Dentistry

